|
| |
|
| (Product Name:) |
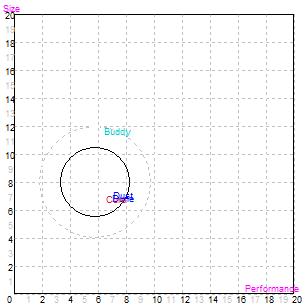
Daze |
Dell |
Dixie |
Dot |
Dune |
Doom |
Dust |
Na |
2014
Total |
Common
Size |
| Sales |
$39,885 |
$39,319 |
$30,469 |
$31,365 |
$39,636 |
$28,785 |
$11,516 |
$0 |
$220,975 |
100.0% |
| |
|
|
|
|
|
|
|
|
|
| Variable Costs: |
|
|
|
|
|
|
|
|
|
|
| Direct Labor |
$12,776 |
$13,842 |
$7,864 |
$9,282 |
$11,728 |
$8,733 |
$3,425 |
$0 |
$67,649 |
30.6% |
| Direct Material |
$15,385 |
$11,314 |
$12,317 |
$14,446 |
$15,714 |
$13,435 |
$4,583 |
$0 |
$87,194 |
39.5% |
| Inventory Carry |
$849 |
$784 |
$1,126 |
$659 |
$132 |
$778 |
$511 |
$0 |
$4,840 |
2.2% |
| Total Variable |
$29,009 |
$25,940 |
$21,307 |
$24,387 |
$27,574 |
$22,947 |
$8,519 |
$0 |
$159,684 |
72.3% |
| |
|
|
|
|
|
|
|
|
|
|
| Contribution Margin |
$10,876 |
$13,379 |
$9,162 |
$6,978 |
$12,061 |
$5,838 |
$2,997 |
$0 |
$61,291 |
27.7% |
| |
|
|
|
|
|
|
|
|
|
| |
| Period Costs: |
|
|
|
|
|
|
|
|
|
|
| Depreciation |
$1,867 |
$2,987 |
$800 |
$1,040 |
$1,040 |
$953 |
$953 |
$0 |
$9,640 |
4.4% |
| SG&A: R&D |
$610 |
$1,000 |
$696 |
$560 |
$623 |
$383 |
$428 |
$0 |
$4,300 |
1.9% |
| Promotions |
$2,300 |
$2,300 |
$2,100 |
$2,100 |
$2,100 |
$2,100 |
$2,100 |
$0 |
$15,100 |
6.8% |
| Sales |
$1,718 |
$1,718 |
$1,718 |
$1,718 |
$1,718 |
$1,718 |
$1,964 |
$0 |
$12,272 |
5.6% |
| Admin |
$633 |
$624 |
$484 |
$498 |
$629 |
$457 |
$183 |
$0 |
$3,509 |
1.6% |
| Total Period |
$7,128 |
$8,629 |
$5,797 |
$5,916 |
$6,111 |
$5,612 |
$5,628 |
$0 |
$44,821 |
20.3% |
| |
|
|
|
|
|
|
|
|
|
|
| Net Margin |
$3,748 |
$4,750 |
$3,365 |
$1,062 |
$5,951 |
$226 |
($2,631) |
$0 |
$16,470 |
7.5% |
| |
|
|
|
|
|
|
|
|
|
|
| Definitions: Sales: Unit sales times list price.
Direct Labor: Labor costs incurred to produce the product that was sold.
Inventory Carry Cost: the cost to carry unsold goods in inventory.
Depreciation: Calculated on straight-line 15-year depreciation of plant value.
R&D Costs: R&D department expenditures for each product.
Admin: Administration
overhead is estimated at 1.5% of sales.
Promotions: The promotion budget for each product.
Sales: The sales force budget for each product.
Other: Charges not included in other categories such as Fees,
Write Offs, and TQM. The fees include money paid to investment bankers
and brokerage firms to issue new stocks or bonds plus consulting fees
your instructor might assess. Write-offs include the loss you might
experience when you sell capacity or liquidate inventory as the result
of eliminating a production line. If the amount appears as a negative
amount, then you actually made money on the liquidation of capacity or
inventory. EBIT: Earnings Before Interest and Taxes.
Short Term Interest:
Interest expense based on last year's current debt, including short term debt, long term
notes that have become due, and emergency loans.
Long Term Interest:
Interest paid on outstanding bonds. Taxes:
Income tax based upon a 35% tax rate.
Profit Sharing: Profits shared with employees under the labor contract.
Net Profit: EBIT minus interest, taxes, and profit sharing.
|
|
| |
| Other |
$6,900 |
3.1% |
| EBIT |
$9,570 |
4.3% |
| Short Term Interest |
$3,492 |
1.6% |
| LongTerm Interest |
$5,309 |
2.4% |
| Taxes |
$269 |
0.1% |
| Profit Sharing |
$10 |
0.0% |
| Net Profit |
$490 |
0.2% |
 |
|
|